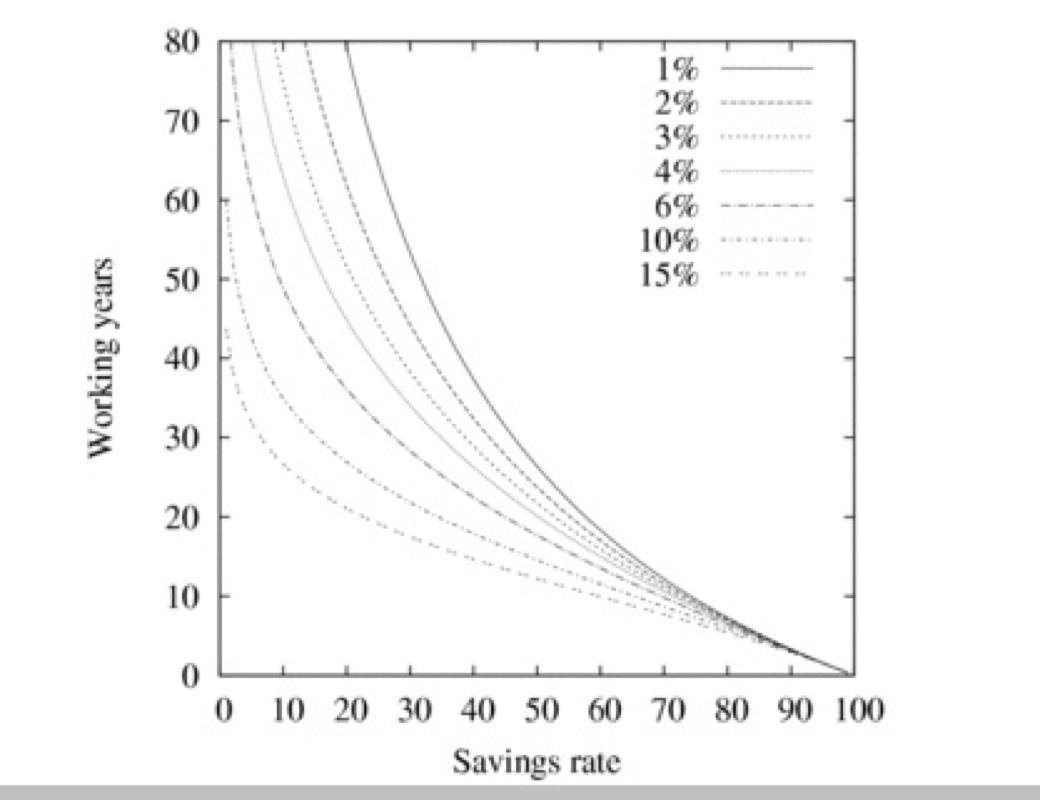
I saw this chart on mrmoneymustache.com and couldn't help but steal it. Its simplicity is brilliant!
If you're wondering how much you need to save in relation to how much longer you need to work than take a look at this. The x and y axes are self explanatory, but I'll explain it anyway.
Start at the bottom and move along the desired savings rate. Then move directly up until it bumps into a rate or return line. I recommend 6% (3rd from bottom) since that's a conservative long term rate of the stock market.
The more you're able to save and live off of, the less years you have to work. For instance, if you want to save 50% at 6% return you will need to work for 20 years. For you Scrooge McDucks out there who can save 75% of your after tax income. Then you only need to work for 10 years!
Don't think this can be done? Entire societies are able to live off half their incomes their entire lives. How do you think the Chinese and Japanese became so rich, so fast?!?!
Print this out and put it on your refrigerator to remind you and to generate discussions. A further note is that this is "after tax income" so whatever you bring home in a paycheck should apply. If you have money taken out pre-tax for a retirement plan. Then this should be added back before you figure the savings amount.

 RSS Feed
